Most organizations have Enterprise Agreement (EA) accounts for Azure billing. Microsoft offers the Cost Management App which can be used to view and analyze Azure costs using Power BI. The Cost Management App only works with EA accounts.
But you might have situations where you are managing Azure billing using Customer Agreement. Microsoft has updated the Azure Cost Manager connector in Power BI to support Customer Agreement. The Azure Cost Management connector for Power BI Desktop can be used to build powerful, customized visualizations and report to help us understand Azure spending.
Azure Cost Management allows 3 kinds of connections:
- Customer Agreement: Common for small business or individual accounts
- Enterprise Agreement: Accounts used by big organizations where payment goes through via purchase orders and such
- Billing Profile: This is sort of like a subset of Customer Agreement. Allows us to organize via rules, like, cost-center, department, etc
To proceed further, make sure you have the Power BI desktop App downloaded and installed on your machine.
Determine Billing Information in Azure
To connect to a billing account, we need to retrieve the Billing account ID from Azure portal:
- In the Azure portal, search for Cost Management + Billing
- Select Billing profile
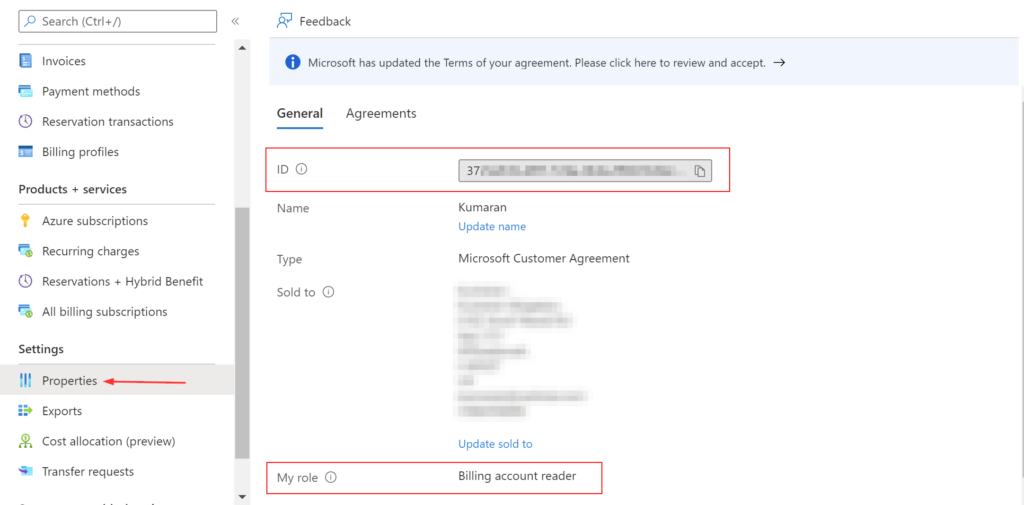
- In the left navigation menu, under Settings in the menu, select Properties
- Make sure this billing account has a at least Billing account reader assigned to it
- This can be determined by clicking on Billing scopes in the left navigation menu or in the Properties tab
- Under Billing profile, copy ID
Connect using Azure Cost Management in Power BI
To use the Azure Cost Management connector in Power BI Desktop:
- Launch Power BI Desktop
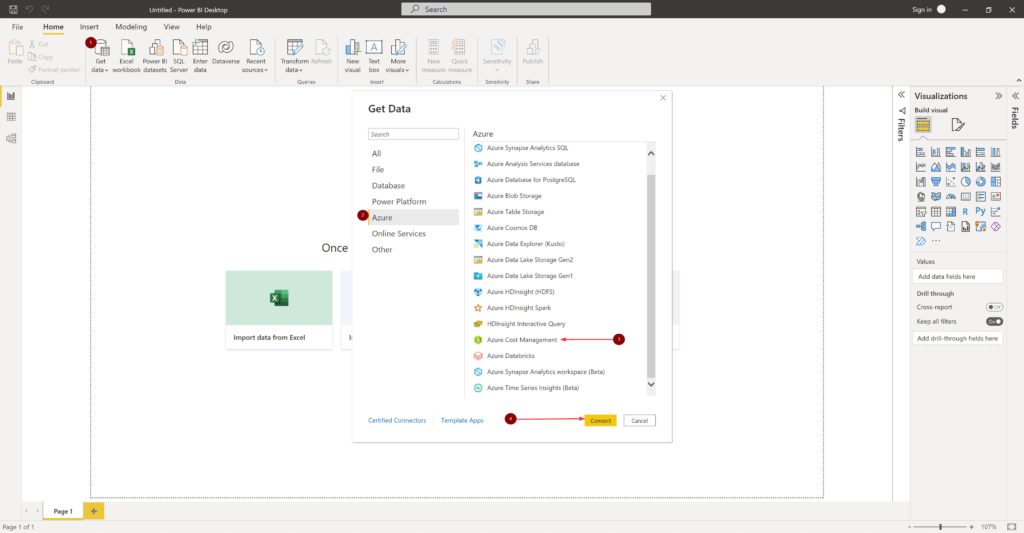
- Click Get data from the splash page or from the Home ribbon
- Click Azure from the list of data categories
- Select Azure Cost Management
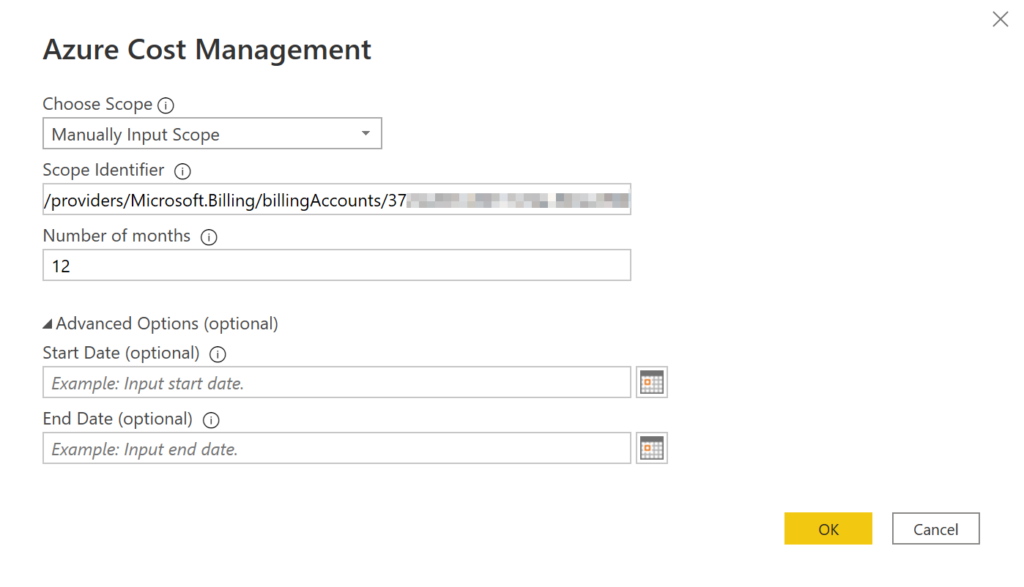
- Under Choose Scope,
- To connect to a Billing Account
- Select Manually Input Scope and input the connection string in below format, with {billingAccountId} that we determined in the earlier section
- /providers/Microsoft.Billing/billingAccounts/{billingAccountId}
- Select Manually Input Scope and input the connection string in below format, with {billingAccountId} that we determined in the earlier section
- To connect to a Billing profile
- Select Manually Input Scope and input the connection string in below format, the {billingAccountId} and {billingProfileId} can be determined in the same properties tab as in earlier section
- /providers/Microsoft.Billing/billingAccounts/{billingAccountId}/billingProfiles/{billingProfileId}
- Select Manually Input Scope and input the connection string in below format, the {billingAccountId} and {billingProfileId} can be determined in the same properties tab as in earlier section
- To connect to an EA account
- Select Enrollment Number and type the account number
- This can be determined by logging into the Azure EA portal
- Select Enrollment Number and type the account number
- To connect to a Billing Account
- I’m entering 12 months but this is up to you
- The Advanced Options can be left blank
- Click OK
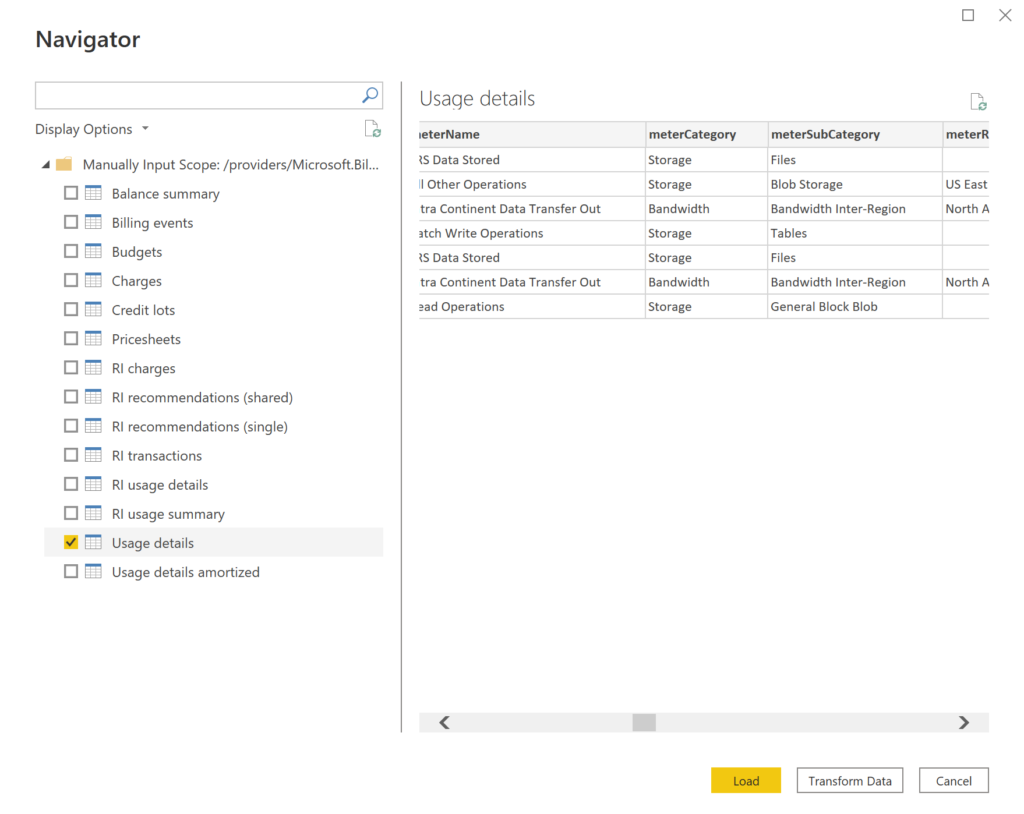
- A Navigator window shows all the available data tables
- Select a table to see a preview dialog
- One or more tables can be selected by selecting the boxes beside their name and then click Load
- For the report I have in mind, I only need the Usage details table and I’m selecting it to be loaded
| Table | Description |
| Balance summary | Summary of the balance for the current billing month for EA |
| Billing events | Event log of new invoices, credit purchases, etc. Microsoft Customer Agreement only |
| Budgets | Budget details to view actual costs or usage against existing budget targets |
| Charges | A month-level summary of Azure usage, Marketplace charges, and charges billed separately. Microsoft Customer Agreement only. |
| Credit lots | Azure credit lot purchase details for the provided billing profile. Microsoft Customer Agreement only. |
| Pricesheets | Applicable meter rates for the provided billing profile or EA enrollment. |
| RI charges | Charges associated to Reserved Instances over the last 24 months. This table is in the process of being deprecated, please use RI transactions |
| RI recommendations (shared) | Reserved Instance purchase recommendations based on all subscription usage trends for the last 30 days |
| RI recommendations (single) | Reserved Instance purchase recommendations based on single subscription usage trends for the last 30 days |
| RI transactions | List of transactions for reserved instances on billing account scope |
| RI usage details | Consumption details for existing Reserved Instances over the last month |
| RI usage summary | Daily Azure reservation usage percentage |
| Usage details | A breakdown of consumed quantities and estimated charges for the given billing profile on EA enrollment |
| Usage details amortized | A breakdown of consumed quantities and estimated amortized charges for the given billing profile on EA enrollment |
- When we select Load, the data is loaded into Power BI Desktop
- Depending on the tables you choose, you may be asked to for authentication
- When the data we selected is loaded, the data tables and fields are shown in the Fields pane
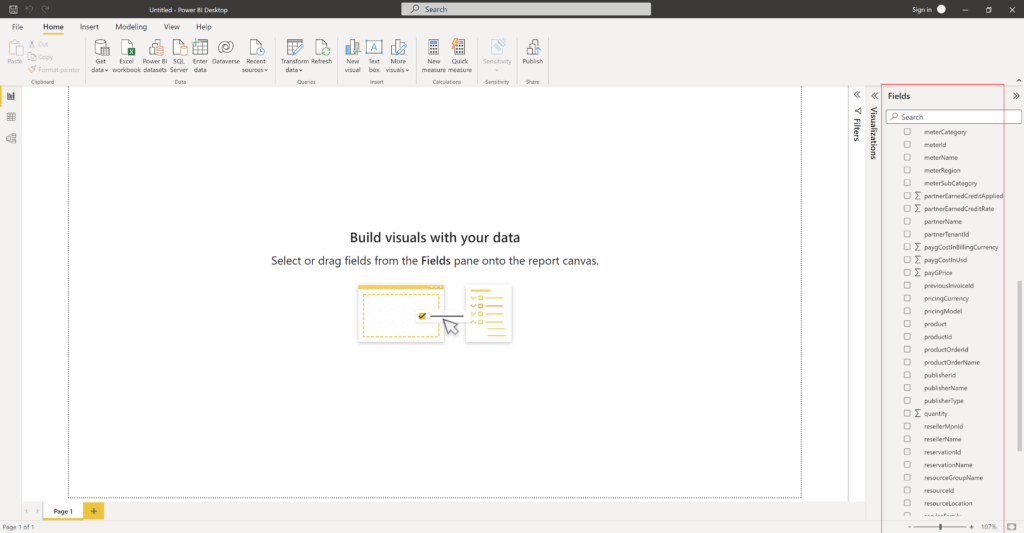
I built this visualization below using some of these fields,
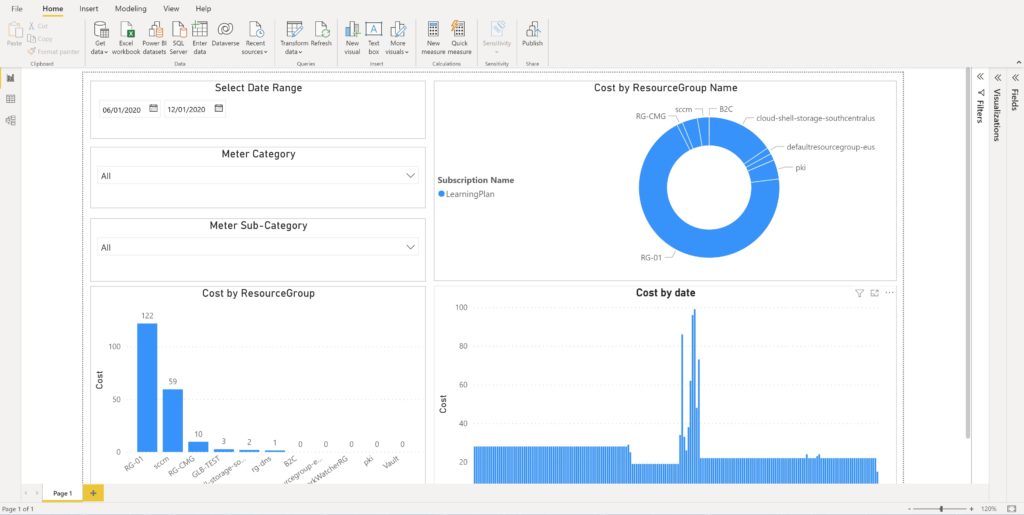
The data is there and you are only limited by the amount on time you have, to spend within Power BI and your imagination.😉
I’m a big fan of Tableau and I love creating visualizations. Now I’ve started using Power BI more and more with Azure related stuff. Plus Power BI Pro comes bundled with Office 365 E5.
Hope this post helped you in setting up your Azure cost reports with Power BI.
Thank you for stopping by. ✌